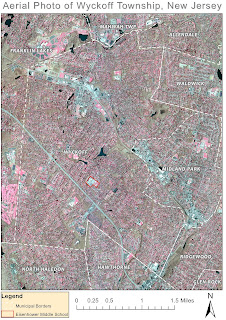
Students will be analyzing surface temperature data by making graphs and by plotting data onto a photographic image of the school campus to show surface heating. In preparation for this next phase of the project, Joe Steinfeld, a graduate student at Rutgers University spoke to students about how scientists use geographic information systems.
In-School Field Trip October 7, 2011
Slideshow by Joe Steinfeld


No comments:
Post a Comment